
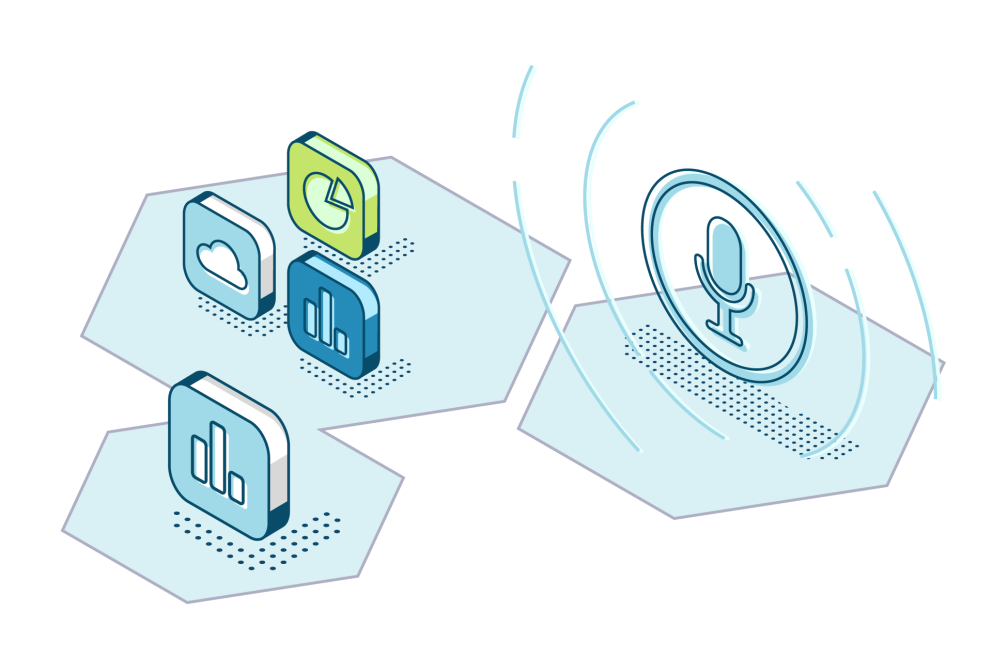
Based on the different data sources in cities to calculate and improve the sustainability of the mobility, GreenMov is developing a set of single services which can be used in any city to measure, monitor and forecast certain values for the cities’ managers. The provided services are relevant for the three cities and regions involved in the project (Nice, Murcia and Molina de Segura, Flanders) but reusable for any city with similar needs. All the services are using data following the Smart Data Models from FIWARE initiative and NGSI-LD standard for data exchange management. The services will be publicly available and there could be more in the future to address other relevant values for green mobility. They will be containerized for easy deployment in the local instance of each city’s platform. Each service is used at least by two cities in the project to validate the reusability requirement.
Air Quality Services

Bikes Availability Service

The main objective of this service is the forecasting of bikes and dockers availability in bikes stations. The service returns the predicted number of bicycles and dockers in each bike station for a given time slot to inform people that are near the station.
This service will provide citizens with information to motivate them in the use of green transport. In addition, it will improve the user experience of all those people who already use the bicycle on a daily basis.
Noise Annoyance Services
This service aims to provide a forecast of the noise annoyance in a specific area, and at a specific time. It includes two different subservices that work sequentially. The first one aims to forecast the different levels of noise in a given area, whereas the second one uses these forecasts and the characteristics of the environment such as the type of buildings and materials, but also the inhabitants’ characteristics to determine an index of annoyance due to the noise. The service returns an index that assess the degree of noise annoyance for the local population.
This service will help to identify time periods and locations for which the noise annoyance is too high and should therefore be limited by reducing the traffic flow in the case the annoyance is identified to be due to traffic.
Traffic environmental impact Services

These services determine the environmental impact of traffic in a given area and at a specific time. Indeed, CO2 emissions from thermal vehicles can have a considerable impact on the local environment. These services are split into two parts. The first part of these services forecasts the traffic characteristics at a specific time in the future. Traffic characteristics include the number of vehicles per type of emission range and the average speed per category. Based on these forecasts, a computation of the traffic environmental impact index is done, using other inputs such as the weather forecast.
The traffic environmental impact will then be used to determine the need to reduce the traffic at a specific time in the future.
Traffic recommendations Service
This service aims to provide recommendations to end-users and public institutions to reduce the flow of individual vehicles by using more public transportation or by using more shared bikes. This service is based on all other GreenMov services, including Air quality forecasting, bikes availability forecasting, noise annoyance forecasting and traffic environmental forecasting. Based on these forecasts, the service first assesses the need for a reduction of traffic. It then computes the suitability of bikes and public transport as an alternative to individual vehicles, and it finally communicates recommendations to end-users and public transportation coordinators to either increase the use of public transportation or the use of bikes.